
A dozen charts shed light on how a K-shaped recovery widens the distance between the haves and the have-nots.
Part I (216) of this 5-part series (#GreatExpectations for the #GreatReset) provided a broad retrospective on the last downturn for both BigLaw and corporate clients, with emphasis on the socioeconomic context around the legal market. The next two posts comprise an experiment in format. Parts II (217) and III (218) are snack-sized posts 🍙🍿 (at least for me 😇), each covering a handful of charts 📊 as background for long-form posts in Parts IV (219) and V (220).
The charts in today’s post explore the economic impacts of 2020 and the implications of a K-shaped recovery for legal markets. A K-shaped recovery refers to divergent recovery outcomes for different subsegments of the economy, both across and within sectors. See Talib Visram, “Forget U or V or W: We may be headed toward a K-shaped recovery,” Fast Company, Sept 11, 2020.
In plain English: a K-shaped recovery is a world with winners and losers. The theory posits that the post-pandemic future will see some market players winning (big) and the rest struggling for the long haul. The data supports this projection, both for the macroeconomic context around legal markets and across the performance spectrum within the 2019 AmLaw 200. In keeping with former analyses characterizing legal markets as extreme, I expect a K-shaped recovery will have outsized impacts on BigLaw. See, e.g., Post 051 (noting structural attributes of legal markets as extremely balkanized and opaque).
🚨 The 2020 crash was really, really bad 😱
So far, the first days of 2021 feel like a bad director’s cut of a terrible movie nobody wanted to rewatch. With awful news coming fast and furious, it’s difficult to keep time in perspective. For my part, the onset of the pandemic feels like it could have been last week or ten years ago.
Here’s a chart from the NY Times as a reminder of how the pandemic led to an intense economic contraction in a VERY compressed time period. The chart shows quarter-over-quarter changes to US GDP going back to 1950. The Coronavirus Correction was the worst dip in GDP on record… and by a lot.

⚠️ The March market crash hit hard across the board, but unevenly…
The panic in equity markets was roughly proportional. As COVID-19 crested in Europe and the Americas, March 16 saw the most drastic single-day drop (10-13% in most global markets), but the entire month of March was historically ugly.
The chart below shows declines in total shareholder returns (TSR, which combines change in stock price plus dividends) as of April 2. Sectors dependent on mobility and social density were hit immediately and severely, but no sector proved to be immune to the Coronavirus Correction. Worthy of note, however, is the significant spread between best- and worst-faring sectors: commercial aerospace, air & travel and oil & gas experienced TSR declines of 40% or more while healthcare supply & distribution, pharmaceuticals, and consumer services held the line around 10% declines.

😰 … followed by a rapid rebound in a few sectors
The next chart depicts the same data but overlays the July 31 (bright blue) view over the March 31 view (dark blue). Healthcare, retail, and TMT enjoyed full rebounds. The reasons for this are many but intuitive. The pandemic drove up market demand for healthcare, TMT was buoyed by implications of lockdowns on work (Zoom) and life (Netflix), and retail recovery got a boost from the late spring / early summer reopenings.
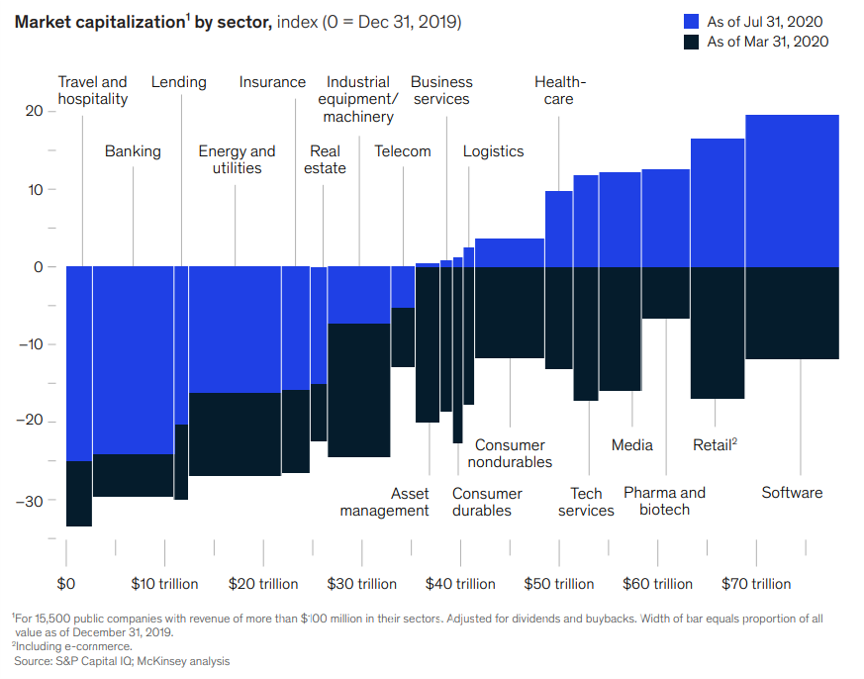
While varied policy on social distancing leads to attendant variations in sectors dependent on micromobility (e.g. people and goods moving around locally), travel and hospitality remained in dire straits. Growing concerns about widespread liquidity crunch insolvency depressed financial services. In an April 2020 report, the IMF projected that banks across advanced economies will struggle to generate profits through 2025. Meanwhile, a global slowdown in the flow of good and people sent oil prices on a precipitous downward spiral, reaching an all-time low in April. See Felix Salmon “What crude oil’s all-time low price means,” Axios.com, April 23, 2020.
This performance dispersion across sectors raises a number of interesting implications for legal services. For the better part of two decades, law firm leaders have struggled to balance their strategic focus across geographic markets, practice areas, and client industries. In 2021, industry-focused go-to-market approaches remain relatively rare among legal service providers, but the ravages of COVID-19 provide strong inducement for law firms to revisit the sector composition of their client base. For new entrants (e.g. LPOs, ALSPs, and, not least, Big 4) as well as legal tech players targeting the corporate legal function, divergent macroeconomic pressures across sectors should provide a much-needed roadmap to inform all-important questions in targeting and prioritization.
(For the #dataviz inclined, here’s a link to an interactive by McKinsey where you can explore this data and watch the 😵 dizzying 🤢 volatility of 2020.)
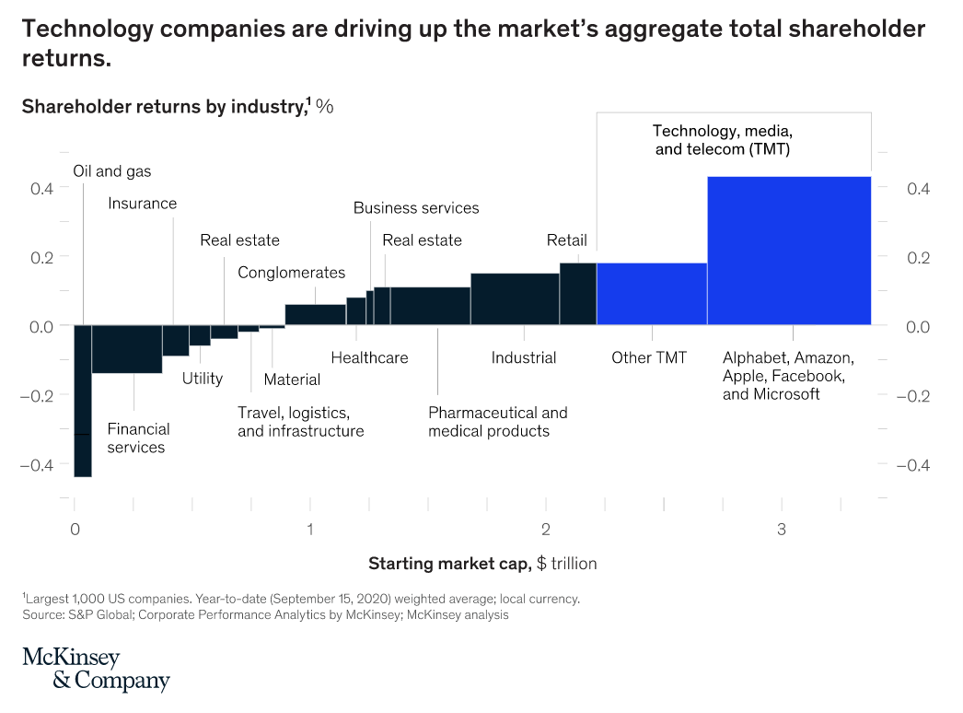
🎉 Even in a world of pain, FAMGA laps the competition (literally)
By Q3, the degree of dispersion in performance becomes clearer. Even within the relatively prosperous TMT sector, FAMGA (Facebook (FB), Apple (AAPL), Microsoft (MSFT), Google (GOOG), and Amazon.com Inc (AMZN), the Nasdaq’s five biggest stocks) outpaces the competition by more than 2x.
Entire sectors experience varying pressures in response to global calamities, and those pressures comprise the competitive context for individual market players — but competition happens in context and within brackets. Ultimately, companies win and lose by beating their own competitor sets in each of their business lines.
Key takeaway: a K-shaped recovery happens at different resolutions: across and within sectors.
🧐 Haves🎩 vs 🤕 Have-Nots 💸 make for a K-shaped recovery
Zooming back out, the below graphic demonstrates why it’s called a “K-shaped” recovery. See Suzanne Clark, “What is the K-Shaped Recovery?” U.S. Chamber of Commerce, Sept 3, 2020 (President of the U.S. Chamber of Commerce outlining just some of the sector-based implications of a K-shaped recovery, with emphasis on employment and small businesses).
Essentially, the winners enjoy a V-shaped or U-shaped rebound, leaving less fortunate players trapped in an L-shaped depression where growth remains elusive for many years (and perhaps forever). For more on the alphabet soup of macroeconomic recovery, check out this cheerful Guide to Economic Recession on Investopedia.

💪 Resilient firms outperform the rest… by a LOT
A retrospective by McKinsey on 1,140 companies illustrates the same K-shaped concept but within sectors. See Cindy Levy, Mihir Mysore, Kevin Sneader, & Bob Sternfels, “The Emerging Resilients: Achieving Escape Velocity,” McKinsey.com, Oct 6, 2020 (data and analysis showing that top 20 percent of companies outperform the rest across margin, revenues, and reinvestment optionality).
The below chart depicts how these performance gains widen the distance over time. By 2017, McKinsey’s “Resilients” more tripled shareholder returns relative to pre-GFC peaks in 2007. In comparison, “nonresilients” were slower to recover to GFC peaks and only achieved anemic growth from 2012 onward. Even amidst the economic turmoil of Q2 2020, McKinsey projected that “emerging resilients” grew margin by 5% while increasing retained profits for reinvestment by 11%; meanwhile “emerging nonresilients” experienced a -16% contraction in margin in Q2 of 2020 while holding retained profits essentially flat.
These metrics essentially explain the mechanics of how rich companies get richer and poor companies get poorer.

🙄 BigLaw is (too) enamored with size, because mileage DOES vary
How, if at all, does this concept apply to legal markets?
☠️🐴 To limit further dead-horse-beating, a quick recap on how quick-and-easy metrics fail us. See Post 216 (quintile analysis of RPL of historical AmLaw 200 from 1998 to 2019). See also Bruce MacEwen & Janet Stanton, “How Not to Think about the AmLaw 200,” Thomson Reuters Legal Executive Institute, June 25, 2020; Jae Um, “The Empire Strikes Back 💥 and 2017 Is (Mostly) a 🎉 Win 🎉 for Am Law 100,” Medium.com, Apr 25, 2018.
- Revenues tell us almost nothing about performance
- For most firms, revenue growth is most tightly coupled to headcount growth
- Segmentation by size is a bad idea and leads to misleading conclusions
The below graphic sums it up. The gray bars line up all 200 of the 2019 AmLaw 200 from #1 on the left (Kirkland at $4.2 billion) to #200 on the right (Hodgson Russ at $101 million). The blue lines plot the PPEP of each firm, forming a line that resembles the cardiograph of someone experiencing a heart attack. Wachtell defends its top PPEP crown as it has for the past dozen years despite ranking 47th in revenue. Only 3 of the top 20 by PPEP crack the top 10 ranking by revenue (Skadden and Latham join Kirkland in this bracket).
Not only is size a poor indicator of performance, point-in-time snapshots give us no sense of resilience over time.

😇 FTFY: a Performance-Based Segmentation of the AmLaw 200
The charts below take a different approach to interpreting law firm resilience over time. Hindsight being 20/20, we trace back the historical performance of the best performing firms and benchmark inflation-adjusted figures against the pre-recession peak in 2007.
Of the 200 firms in last year’s AmLaw rankings, 31 are excluded from the below analysis. This group includes (a) firms who have tied up since the last recession (e.g. Dentons, Arnold & Porter Kaye Scholer, Hunton Andrews Kurth, etc.); (b) a rotating roster of firms that tend to drop off the tail end of the rankings from year to year (e.g. Hodgson Russ, Lane Powell, Strasburger & Price, Sills Cummis & Gross, etc.)
The remaining 169 firms are divided into two categories:
😌 Resilients: 56 firms qualify as Resilients based on performance measures across profit, revenue generation, and volatility.
😨 Everyone Else: The remaining 113 firms are grouped together for analysis. As you will see, they lag Resilients significantly across all key metrics.
Bear in mind that this segmentation is outcome-based. Though a bit top-heavy, Resilients span the breadth of the AmLaw 100, with 40% falling outside the AmLaw 50, including six firms from the Second Hundred. (☝️ As I’m known to say ☝️, bigger isn’t better… BETTER IS BETTER.) A handful of old and illustrious shingles in historically tony zip codes of NY and DC missed the mark (but more on this in the next post). A few (VERY) profitable boutiques are grouped with “Everyone Else” rather than “Resilients” simply based on the volatility intrinsic to their business (big deals & big cases); this is notable because they provide considerable lift to the overall index performance of the lagging group.
Also worth noting is the fact that this analysis (like all data on the current top performers) is subject to artificial lift by means of survivorship bias. Simply put, this analysis excludes all the high-performing firms of the past that stopped performing so well and have hung up their shingles, whether by means of dissolution (Dewey, Howrey, etc.) or by absorption into bigger platforms (too many to name). See Jae Um, “Outwit, Outplay, Outlast: A Post-Recession View of the Survivors,” law.com, June 20, 2018 (analysis of 44 firms that have dropped off the 2008 AmLaw 100, including 7 dissolutions and 32 firms now operating under new shingles).
Lastly, these charts trace back the historical performance of each distinct firm by year, comprising a longitudinal comparison. In English, this means the charts below reflect the actual lived experience of firms within each category.

The graphic above includes five charts, three focused on comparative analysis across performance KPIs and two depicting management metrics (leverage and headcount) that shed greater light on how those outcomes are achieved.
Financial KPIs: All three charts depict clear K-shaped patterns across (a) profits per equity partner (PPEP), (b) partner compensation per lawyer (PCPL), and (c) revenue per lawyer (RPL). These KPIs are chosen because they wash out overall size.
Management metrics: Changes in leverage and headcount, again pinned to pre-GFC peak in 2007, were chosen because these two highlight key differences that do much to explain the performance dispersion across the two groups.
Taken together, five points of interest emerge:
💨 Resilients recovered more quickly relative to the rest, exceeding pre-GFC peak for PPEP in 2012 and partner compensation per lawyer by 2013.
🤥 The laggard group managed to hit 2007 PPEP levels by 2014 but have failed to regain ground in either PCPL or RPL metrics. This suggests the PPEP growth posted by laggards is somewhat illusory, primarily a result of aggressive changes to leverage in the same period. To put it more gently, most law firms have managed shareholder value by flexing cost-side levers; abysmal RPL trends suggest these firms remain weak (and face ever stronger headwinds) in managing revenue drivers, such as demand generation & response (to grow wallet & market share in existing businesses) as well as service line innovation (to create new service line offerings that extend into new markets). See Post 062 (analyzing cost reduction, revenue growth, and new markets as categories of strategic objectives for law firm innovation).
💸 RPL was hit hardest in the last recession, with even Resilients posting a U-shaped recovery with sustained pressure through 2013. The laggard group has never recovered lost ground in RPL.
😰 A combined analysis of RPL and headcount trends from 2012 onward is very suggestive. Resilients posted two separate waves of RPL recovery, first from 2013 to 2015 and again from 2017 to 2019. Resilients accelerated headcount growth in 2014, indicated by a steeper slope in 2014 to 2019 relative to the previous 5-year stretch. In contrast, the lagging group have posted steady headcount growth from pre-recession peaks, reflecting sustained frothiness in the lateral market and sustained merger activity in the past decade. As against RPL trends that remain depressed, this suggests that a lot of firms are doubling down on growth (and attendant swelling of payroll obligations) even as marginal revenues and profits continue to contract, a concerning signal for market-wide risk — and a clue as to the anxiety levels of incumbent law firms heading into the next downturn.
🧐 Resilients went into the Great Recession in a stronger position relative to Everyone Else, posting a median PPEP of $1.4m in nominal 2007 dollars (nearly double the $748k median PPEP for Everyone Else that year). By 2019, these 56 firms have pulled away, posting a median PPEP of $2.6m (relative to $899k for Everyone Else). The average figures for PPEP indicated below suggest that these categories themselves likely comprise power curves with long tails.
💥 The World Is Changing (Drastically): That Means the Post-Pandemic Landscape Will Have Clear Winners & Losers
History often repeats itself, particularly when fundamental economic principles and market forces are in play. As often as we lament how poorly law does business, legal markets are not immune from these broader mechanics of recession and recovery.
The charts above give a sense of the stakes involved. Simply put, the stakes are very high.
Stay tuned for Parts III and IV of the #GreatExpectation series. In Part III, we’ll take a similar data-based (and snack-sized) look at specific firms that won big in the post-GFC recovery and recap the 2020 position for NewLaw and legal tech segments. In Part IV, we’ll tie it all together to knit a plausible theory for what the post-pandemic market will look like.