It’s also compounding racial inequality. The story in ten charts.
My fundraising work for the Institute for the Future of Law Practice has required me to delve into the equities of modern legal education, particularly around the debt loads and employment prospects of historically underrepresented groups. This is because virtually all potential benefactors want diversity and inclusion baked into anything they fund. What I’ve discovered has truly shocked my conscience.
The failure is both large and longstanding. Further, the competitive dynamics of US legal education are only making things worse.
The post is organized around ten data charts that cover three themes: (a) graduate education (inclusive of law school) and its connection to economic and social mobility, (b) first-generation college students who are pursuing law degrees, and (c) the large overlap between race and class. The ten charts, however, do most of the talking.
I end with a few editorial comments—not too much, however, because we all need some time to digest the magnitude of this failure.
(a) graduate education and social and economic mobility
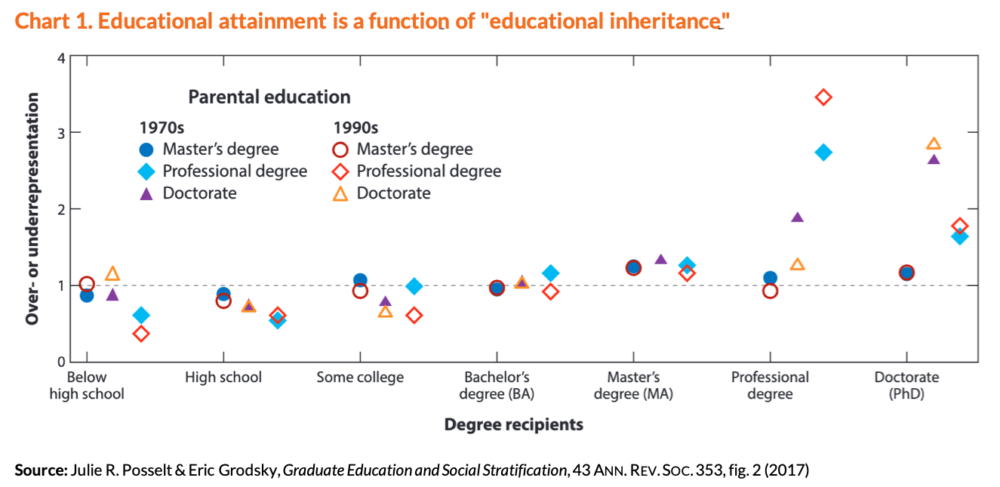
Chart 1. Educational attainment is a function of “educational inheritance”
The lead graphic above shows, in a visual format, the concept of “educational inheritance.” See Julie R. Posselt & Eric Grodsky, “Graduate Education and Social Stratification, “43 Ann. Rev. Soc. 353, 356 (2017) (pulling data from National Survey of College Students, NSF 2013).
Basically, if either your mother or father earned a professional degree in the 1990s, you are 3.5 times more likely to also earn a professional degree. This extremely large boost in probability is only a slight increase from 20 years earlier (compare red and blue diamonds over professional degree column) when the probability was 2.5x. The same phenomenon can also be observed for parents with doctoral degrees—their children are 2.5-3x more likely to earn a doctorate and nearly twice as likely to earn a professional degree.
Unfortunately, educational inheritance also works in the opposite direction. Using the population as a whole as a baseline, first-generation college graduates are significantly underrepresented among those earning professional degrees. See Byeongdon Oh & ChangHwan Kim, “Broken promise of college? New educational sorting mechanisms for intergenerational association in the 21st century,” 86 Soc. Sci. Res. __ (Feb. 2020) (using statistical analysis to isolate how educational advantage compounds intergenerationally).
Chart 2. Graduate degrees lead to higher household income

The relationship between educational attainment and income is obvious to everyone. Chart 2, however, shows the strength and magnitude of the relationship.
To the extent that demand for graduate education is relatively price inelastic, this chart explains why.
Chart 3. Graduate education is gateway to power

Only 14.6% of workers of US workers over the age of 25 have a masters, doctorate, or professional degree. See U.S. Bureau of Labor Statistics, Tbl. 5.3 (2016-17). Yet, as shown in Chart 3, these degrees have become a prerequisite to positions of power in corporate America.
As high as these educational requirements are, the bar appears to be even higher for women and racial minorities. Among Fortune 500 corporate directors, 69.7% of white males have a graduate degree versus 74.5% for white women, 71.7% for Latinos, 88.8% for African Americans, and 94.7% for Asians. See Richard Zweigenhaft, “The Role of Elite Education for White Men, White Women, and People of Color in the U.S. Corporate Elite,” presented at Elite Educational Conference (Toronto, June 2015).
So, to non-majority knowledge workers who aspire to power and influence, the message is clear: graduate education is a de facto requirement.
(b) legal education and first-generation college grads
Chart 4. Most law school financial aid is “merit-based”
 The vast majority of law students receiving grant-based financial aid are receiving it in the form of “merit-based” scholarships, which means it is likely tied to academic credentials used in the admission process.
Unfortunately, as the competition for high-credential law students has heated up over the last 20 years, total dollars for merit-based grants have grown roughly 10x times faster than total dollars available for need-based grants. See LSSSE, 2016 Annual Results at 8 (citing data from American Bar Association).
This is occurring because of the prisoner’s dilemma of prioritizing affordability over prestige—changing priorities at the school level cannot be done without significant market consequences that weaken a school’s long-term market position and finances. Sure, morality is involved, but the solution has to be at the government or regulatory level. More on this below.
Chart 5. Less merit-aid goes to first-generation college grads
 It’s a strange world that gives the largest subsidies to students from the most affluent families.
As of 2015, 47% of first-generation law students were exiting law school with more than $100,000 in debt compared to 34% of students with at least one college-educated parent. See LSSSE, 2016 Annual Results at 12
Of course, as shown in the next two charts, there is a simple reason why.
Chart 6. Merit-based aid is based on LSAT scores

Merit aid is overwhelmingly driven by LSAT scores …
Chart 7. First-gen college grads tend to have slightly lower LSATs
 And first-generation college grads tend to have slightly lower LSAT scores.
So what does this privilege look like at the ground level? On average, a first-generation law student is spending 8.0% more time (~2 hrs/ week) studying and 25% more time doing paid work (~3 hrs/week). See LSSSE, 2014 Annual Results, at 11. That’s a half-day of additional responsibilities per week. That is a lot of time when stretched over three years.
Yet, the story has another layer of inequity.
(c) Overlap between race and class
Chart 8. Large overlap between first-gen and minority students

Underrepresented minority students are much more likely to be first-generation college graduates.
This is such a stark gap. Further, it cries out for a coordinated policy response. Nearly 20 years ago, a prominent professor in higher education research wrote:
The weight of evidence … indicates that, compared to their peers, first-generation college students tend to be at a distinct disadvantage with respect to basic knowledge about postsecondary education (e.g., costs and application process), level of family income and support, educational degree expectations and plans, and academic preparation.
Ernest T. Pascarella, et al., “First-Generation College Students,” 75 J. Higher Ed. 249, 250 (2004). Obviously, when a first-gen student is also a racial minority, there’s a compounding of disadvantage.
Chart 9. White students get the largest proportionate share of merit aid

If we value racial diversity, why are shoveling most of our financial aid dollars to white students, most of whom tend to come from more affluent families?
Here is my best guess on what is happening: After doing everything in our power to maximize the inputs for US News rankings (LSAT and UGPA), we focus on diversity. And then we only focus on diversity as a percentage of total enrollment and, by default, ignore the uneven and unfair financial burdens we have placed on our students. It is easy to ignore because measurement and quality control are not part of our culture. Instead, we have longwinded meetings and promulgate rules and resolutions, which are words we struggle to implement.
As someone specializing in legal industry data, I never dug this deeply into issues of class and racial equity until potential IFLP funders starting asking the right hard questions. This is akin to opening the wall of your home and finding a terrible infestation.
Finally, below is the data chart that truly shocked by conscience.
Chart 10. Total law school debt, by race

If we view total student debt as the functional cost of law school, at least as borne by the individual student, Hispanic/Latinos are paying a 50% premium for law school and blacks are paying double the costs of their white counterparts.
The data presented in part (a) above reveal why a student—rich or poor, white or non-majority—would go deeply into debt to pay for a law degree. But why charge black students twice as much?
It is worth noting that since the Great Recession, law schools have filled empty seats by enrolling large numbers of underrepresented minority students. This is because in the queue to get admitted into law school, the largest proportion of prospective minority students are in the next available tranche of credentials. See Aaron N. Taylor, “Diversity as a Law School Survival Strategy,” 59 St. Louis U. L.J. (2015). Nonetheless, as a group, this cohort of more diverse students is destined to graduate with very high debt and relatively low entry-level salaries, as they are disproportionately clustered in lower-ranked schools.
These bleak statistics build upon a tradition of inequity. For example, data from After the JD (Wave III) reveal that 12 years after graduation, 60.1% of Asians law grads, and 48.4% of Whites, had zero educational debt compared to only 30.4% of Hispanics and 23.3% of Blacks. See After the JD III: Third Results from a National Study of Legal Careers at 81, tbl. 10.1 (2014).
No one “designed” these outcomes as a matter of policy. Rather, they have all been an outgrowth of 200 law schools competing for a shrinking supply of law students. Yet, from a distance, this has all the hallmarks of structural racism. How are we going to fix it?
Editorial comments
The ten charts in this post reveal the rudderless state of legal education. As a collection of institutions, we are not serious about educational quality and equity because we don’t govern ourselves with any discipline around measurement or data.
But more troubling, when we cannot escape the foolish and harmful features of our current system, where do we turn for a remedy—the American Bar Association? The Association of American Law Schools? The supreme court justices in 50 different states? The Department of Education? It’s hard to say which is the bigger challenge—the will to act or the authority to compel change.
As a profession, we are consumed with the pursuit of individual and institutional prestige. Unfortunately, we are now four generations removed from the estimable acts that created our current prestige hierarchies. We have more in common with our political system than we care to admit, as we also seem to lack the will, leadership, and courage to follow the data to cure our own diseases.
I’ll return to this topic after we’ve all had some additional time to digest.