 The ABA just released 10-months out employment data for the class of 2016. The percentages of grads employed in full-time/long term Bar Passage Required and JD Advantage jobs is up (72.5% compared to 70.1% in 2015). However, the total number of these jobs is down (28,029 to 26,923).
Is this good news for law schools?
Not really. The employment percentage is up only because the number of law grads is dropping faster than the number of jobs. But both numbers — grads (supply) and jobs (demand) — are declining. A true recovery would show the opposite.
A 28% Drop in the Number of Law Grads
The graph above reveals a dramatic drop in the number of law grads. The green bars reflect historical data. The orange bars are projections for the next three years based on incoming 1L classes that have already enrolled. (Based on a 10-year historical average, 90.1% of entering 1Ls receive a JD three years later.) Between 2013 and 2019, the size of graduating classes will drop 28.0%.
This may be the bottom of the trough, as the number of projected graduates is essentially identical for ’18 and ’19 (33,667 versus 33,658). Yet, it would be mistake to assume that things are headed back to normal. We have to go back to 1978 to find graduating classes this small. At that time, the US population totaled 223 million. Since then, we’ve added another 100 million people.
A population gain that large should translate into a lot more divorces, wills, contract disputes, DUIs, and personal injury claims, etc. And likely it has. But it may be the case that a growing proportion of these legal problems cannot be cost-effectively solved by lawyers (more on this below).
The Old Era of Bad Employment Data
 As the job market collapsed in ’08-’09, law schools came under intense pressure to provide higher quality employment data. At the time, the only metric collected by the ABA was employment 9 months after graduation. Yet, the definition of “employed” did not distinguish between jobs that were legal versus non-legal, or full-time versus part-time or temporary. Because US News used this metric in its ranking formula, it became normal for schools to aggressively count all jobs regardless of quality.
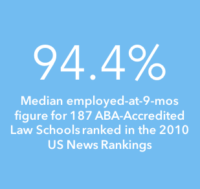
In the 2010 US News rankings, the median employed-at-9-months figure was a remarkable 94.4%. In contrast, NALP data published in the spring of 2010 showed only 82.0% of law grads obtaining either Bar Passage Required or JD Preferred jobs. Terms of use with member law schools prohibited NALP from reporting school level data. But obviously the numbers weren’t adding up.
As the job market continued to stagnate, law schools got hammered in the press and blogosphere for publishing unreliable, self-serving data. Former students and alumni filed lawsuits against more than a dozen ABA accredited law schools alleging various theories of consumer fraud. Industrious law students at Vanderbilt Law used the bully pulpit of the Internet to create Law School Transparency (LST) and demand that law schools release more granular information on employment. And eventually it worked.
The New Era of Data Transparency
The ABA Section on Legal Education and Admissions to the Bar responded to the public pressure by agreeing to collect, publish, and periodically audit granular information on employment outcomes. That information can now be readily downloaded from an online database. Several other outlets now incorporate these data into online tools to improve decision making for prospective law students. See, e.g., Law School Transparency (LST), AccessLex Institute (Analytix), Educating Tomorrow’s Lawyers (ELT), Above the Law (ATL).
The chart below reflects employment outcomes (i.e., demand for new law graduates) since the ABA stepped into its new role as collector and disseminator of high-quality market information.
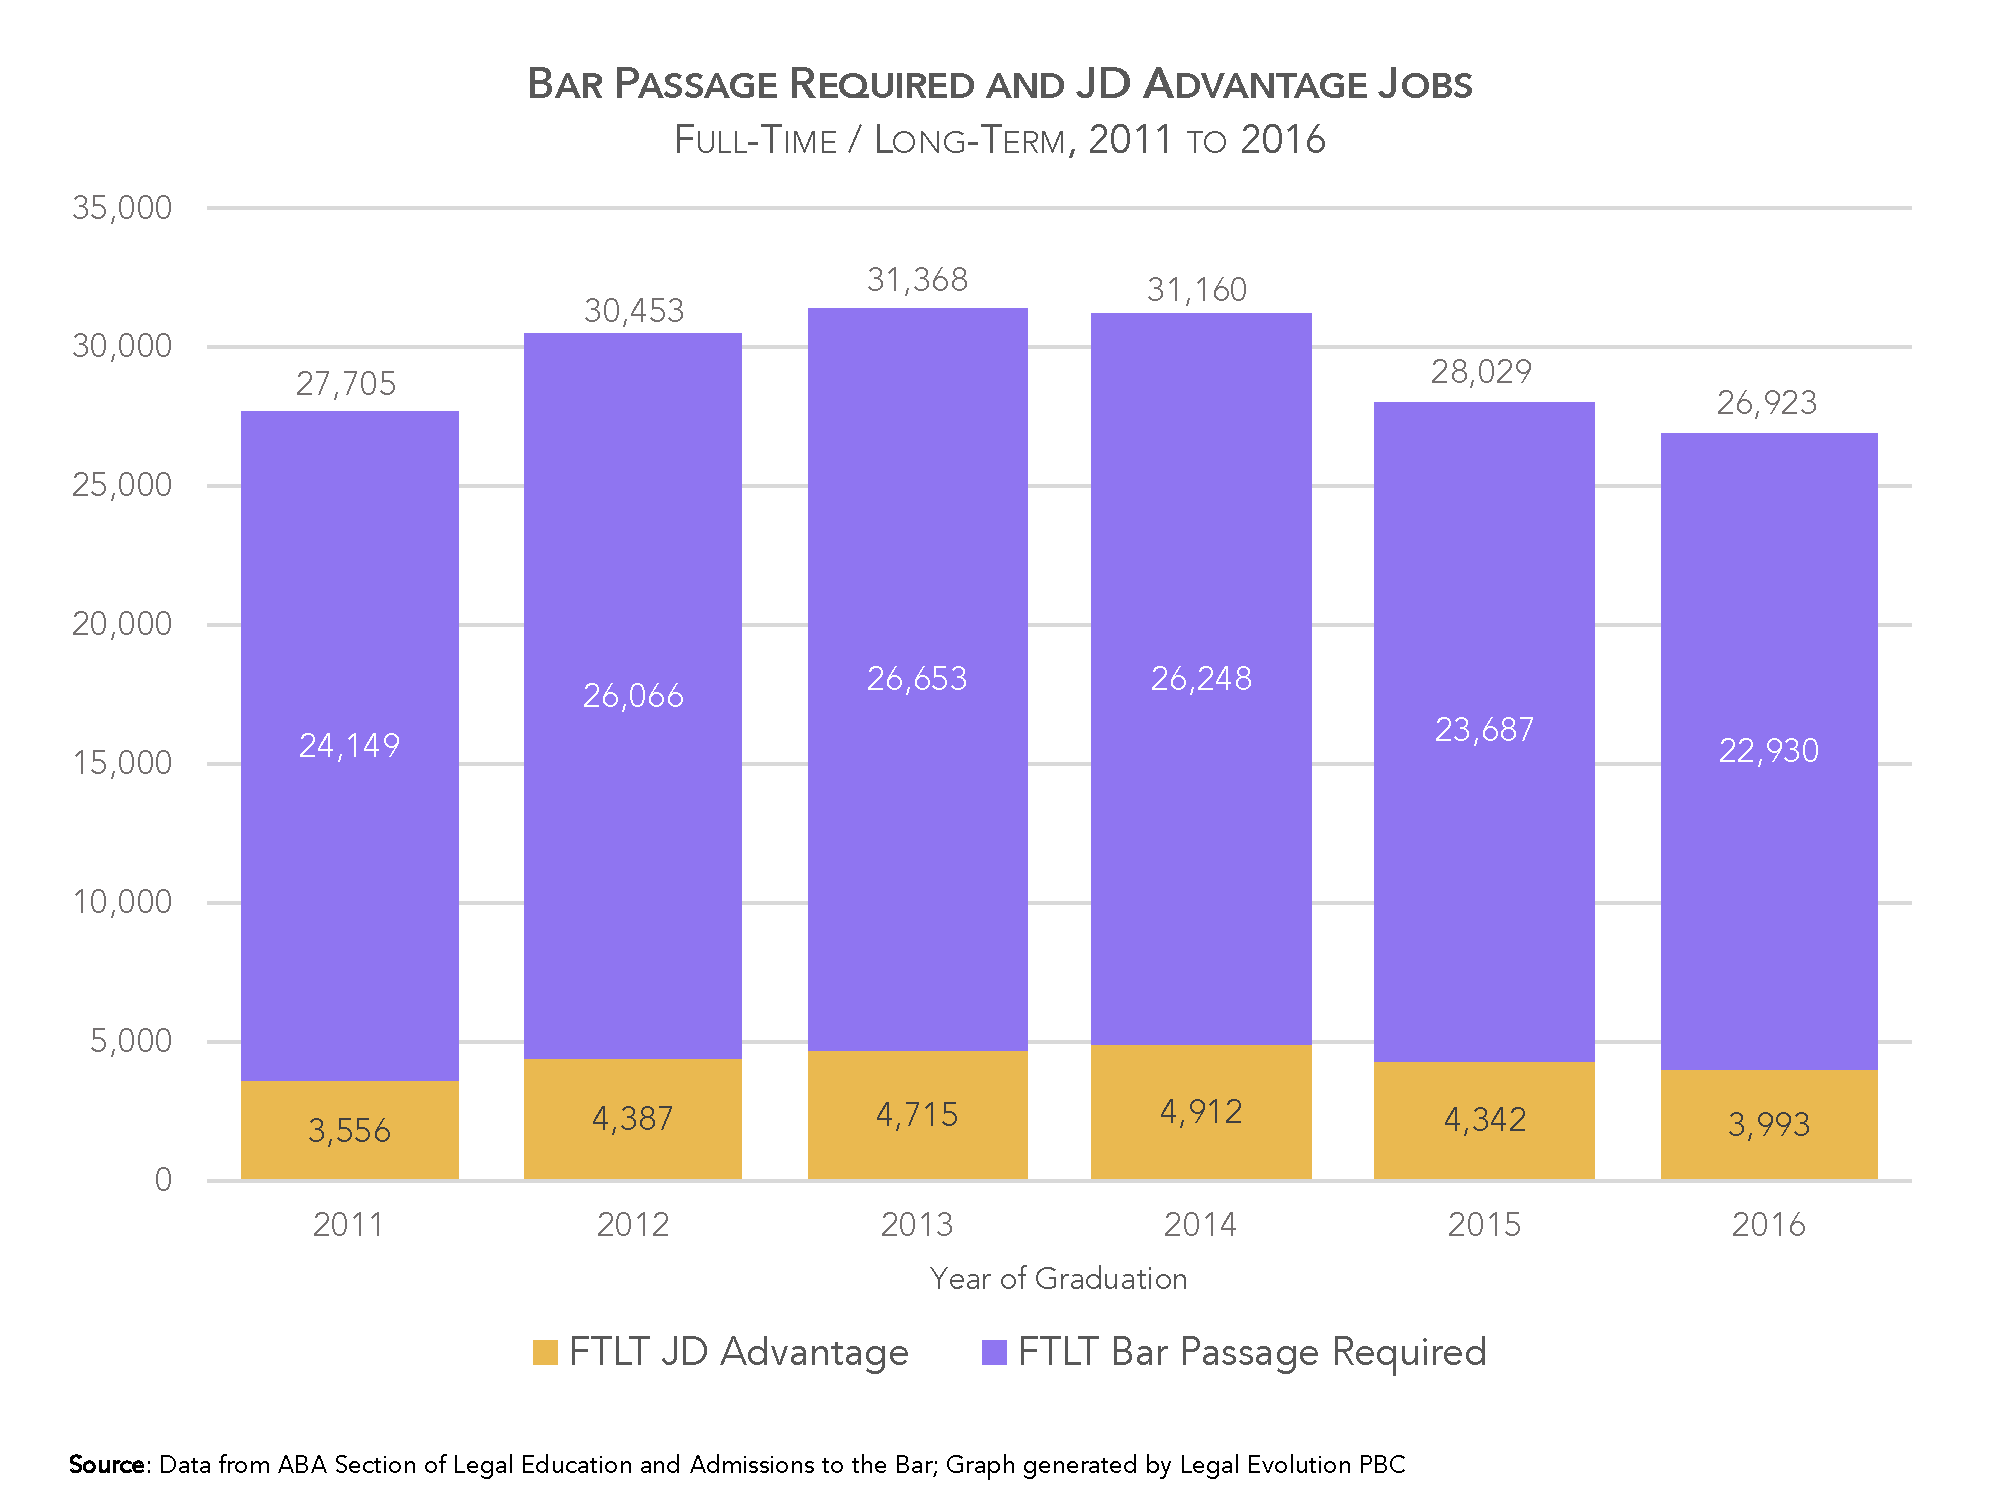
The key takeaway is that the entry-level market for law grads remains very soft. Of the six reporting years, 2016 had the fewest number of FTLT Bar Passage Required or JD Advantage jobs. The numbers look better when they are expressed as a percentage of total class size, as in the table below:
| 2011 | 2012 | 2013 | 2014 | 2015 | 2016 |
| 63.0% | 65.7% | 67.1% | 71.1% | 70.1% | 72.5% |
Yet this trend is moving up only because we are at a 40-year low in the number of law grads. See Green/Orange chart above. Enrollments are down because entry-level employment for law grads is down. That’s the impact of the new era of transparency.
When will law school enrollments increase? When there is a surge in high quality employment for law grads. It’s just that simple. Legal education now operates in a real market.
Legal Problems and Legal Productivity
I created Legal Evolution because I became convinced that the biggest problem facing the legal profession and legal education was stagnant legal productivity. Stagnant productivity is bad because it means that solving legal problems is becoming, in a relative sense, more expensive over time. Thus, as practical matter, fewer people and businesses can afford to hire a lawyer to solve a legal problem. Those are the economic forces driving the green/orange chart above.
The problem of legal productivity will be recurring theme here. But a brief, concrete illustration is especially helpful for this post, as there is a systemic breakdown occurring in the practice of law. This is a substantial root cause of underemployed law grads, flagging starting salaries, and lower law school enrollments.
The NCSC Landscape Report
 The illustration comes from the Landscape of Civil Litigation in State Courts, a 2015 study published by the National Center for State Courts (NCSC). The study compiled data from over 925,000 cases disposed of in state courts in ten large counties that encompass major U.S. cities (Chicago, Cleveland, Honolulu, Houston, Indianapolis, Miami, Phoenix, Pittsburgh, and San Jose). The sample was constructed so that it would be representative of the nation based on geography. The NCSC also wanted a mix of general and limited jurisdiction courts.
Below is Table 6, which breaks down the judgment size for the 227,812 cases that resulted in judgments exceeding $0.

Remarkably, the median judgment was for $2,441, increasing to $5,595 for matters in general jurisdiction courts. These small sums make it very difficult for lawyers to ethically serve clients and also earn a living. Thus, perhaps it is not surprising that only 24% of cases had the benefit of attorney representation on both sides of the dispute. Stated in the alternative, 3/4 of cases involve a party that is going it alone without a lawyer.
The Landscape report acknowledges the sharp divergence between “Justice (with a capital J)” and what actually goes on in state court. The only way to fix it, the report concludes, is through “dramatic changes in court operations … to control costs, reduce delays, and improve litigant’s experiences with the civil justice system” (p. 38). The problem of affordable legal solutions is so big that non-lawyer entrepreneurs are engineering their business models around Rules 5.4 and 5.5 to access the market opportunity. In the mean time, the organized bar — judges, lawyers and legal educators — wonder why our numbers are falling.
Related Post: A Measure of Overcapacity in Legal Education (002)
What’s next? See Units of Analysis and Adopter Types (007)